

The power of SQL and the performance challenge
One of the great advantages of SQL is its declarative nature. That means you don’t have to tell the database how to get the data; you just specify what you want. The Oracle optimizer (CBO) takes care of finding the best way to execute your query.
However, the path chosen by the database is not always the most efficient one. In complex queries or with large data volumes, performance can take a hit. But how do you identify and fix these problems?
The answer lies in the execution plan.
What is an execution plan?
The execution plan is a detailed roadmap describing the path Oracle will follow to retrieve the data requested by a SQL query. This plan is generated during the parse phase of the SQL statement.
To build this execution path, Oracle takes several pieces of information into account, including:
- Database statistics: these include system statistics and data statistics, which help predict the best way to access tables and indexes.
- Database instance parameters: instance-specific settings that influence the optimizer’s decisions.
These factors feed the CBO (Cost-Based Optimizer), Oracle’s optimizer, which calculates the most efficient strategy to execute the SQL query. The execution plan therefore represents the database’s best estimate of how to retrieve the information as quickly and efficiently as possible.
Difference between execution plan and explain plan
EXPLAIN PLAN and EXECUTION PLAN: what is the difference?
When working with SQL queries in Oracle, it is essential to understand the difference between two types of plans: EXPLAIN PLAN and EXECUTION PLAN.
Explain plan
EXPLAIN PLAN is a prediction of what Oracle plans to do to execute the query. When you run an EXPLAIN PLAN, the database generates an estimated execution plan based on the current table statistics and the optimizer’s algorithms. This can be useful for understanding the strategy chosen by the optimizer before actually running the query.
However, the EXPLAIN PLAN can be wrong or differ from the actual execution plan, because:
It does not actually execute the query, it only makes a prediction.
If the database statistics are outdated, the prediction can be inaccurate.
EXPLAIN PLAN FOR
SELECT * FROM TABELA_XPTO WHERE coluna = 'valor';

SELECT * FROM TABLE(DBMS_XPLAN.DISPLAY);
Execution plan
The EXECUTION PLAN, on the other hand, shows what actually happened when the query was executed. It displays:
The exact sequence of operations performed by the database.
The time spent on each operation.
The actual number of rows processed.
The impact of I/O (reads and writes to disk or memory).
Whether the query used indexes, joins, sorts or full table scans.
SELECT * FROM TABLE(dbms_xplan.display_cursor('<SQL_ID>','<CHILD_NUMBER>','ALLSTATS LAST +PEEKED_BINDS +PREDICATE +COST +BYTES ADVANCED'));
By analyzing the route the database took, you can identify whether it chose the most efficient path or whether there is an even faster alternative, such as creating a shortcut.
Below is the execution plan for a join between two tables:
--------------------------------------
| Id  | Operation          | Name    |
--------------------------------------
|   0 | SELECT STATEMENT   |         |
|   1 |  HASH JOIN         |         |
|   2 |   TABLE ACCESS FULL| TAB_A   |
|   3 |   TABLE ACCESS FULL| TAB_B   |
--------------------------------------


Cada linha no Execution Plan (Plano de Execução) representa uma operação distinta. Essas operações estão organizadas em uma estrutura hierárquica, formando um relacionamento de pai/filho.

O plano pode ser visualizado como uma árvore. A instrução SELECT, localizada no topo, é a raiz; as tabelas, situadas na parte inferior, são as folhas; e, entre elas, há uma série de operações intermediárias.

Essas operações se dividem em três categorias principais:

- Single-child operations (Operações de filho único)
- Multichild operations (Operações de múltiplos filhos)
- Joins (Junções)
Single-child operations
As the name suggests, this type of operation always has exactly one operation below it in the execution plan tree. Common examples include:
- Grouping
- Sorting
Multichild operations
These operations can have one or more operations below them and are rarer. The most common one you may see in an execution plan is the UNION (ALL) operation, which combines the results of multiple queries.
Joins
Joins always have exactly two children. These children can be:
- Other joins
- Tables
- Any other operation in the execution plan
Each of these components plays an essential role in how the database processes the query, directly influencing the efficiency and performance of the execution.
How to read or interpret an execution plan
In a text-based execution plan, the hierarchical structure of the operations is represented by the level of indentation. This indentation indicates the parent/child relationship between operations.
- Parent operation: always the first line above an operation, with less indentation.
- Child operations: the lines right below the parent operation, indented further to the right. They belong to the parent operation until another line with the same indentation level appears.
This structure helps you visualize how the operations relate to each other and understand the order in which the database executes each step of the query.
To illustrate the hierarchical structure of an execution plan in Oracle, let’s walk through a practical example. Suppose we have two tables: clientes and pedidos. We want to select all customers and their respective orders. The SQL query would be:
SELECT c.nome, p.numero_pedido
FROM clientes c
JOIN pedidos p ON c.cliente_id = p.cliente_id;
When we generate the execution plan for this query, we would get output similar to:
--------------------------------------------------------------------------------
| Id  | Operation           | Name    | Rows  | Bytes | Cost (%CPU)| Time     |
--------------------------------------------------------------------------------
|   0 | SELECT STATEMENT    |         |   100 |  5200 |    10   (0)| 00:00:01 |
|*  1 |  HASH JOIN          |         |   100 |  5200 |    10   (0)| 00:00:01 |
|   2 |   TABLE ACCESS FULL | CLIENTES|   100 |  2600 |     5   (0)| 00:00:01 |
|   3 |   TABLE ACCESS FULL | PEDIDOS |   200 |  5200 |     5   (0)| 00:00:01 |
--------------------------------------------------------------------------------

Vamos interpretar esse plano de execução, destacando as relações pai/filho:

Operação Raiz (Pai Principal):

Id 0: SELECT STATEMENT é a operação raiz. Todas as outras operações são suas filhas diretas ou indiretas.

Operação Filha da Raiz:

Id 1: HASH JOIN é filha direta do SELECT STATEMENT. Esta operação combina as tabelas CLIENTES e PEDIDOS usando um algoritmo de junção hash.
Operações Filhas do HASH JOIN:

Id 2: TABLE ACCESS FULL na tabela CLIENTES. Esta operação lê toda a tabela CLIENTES e fornece os dados para o HASH JOIN.

Id 3: TABLE ACCESS FULL na tabela PEDIDOS. Similarmente, lê toda a tabela PEDIDOS e passa os dados para o HASH JOIN.

Observações Importantes:
Recuo (Indentação): No plano de execução baseado em texto, o nível de recuo indica a hierarquia das operações. Operações com maior recuo são filhas da operação imediatamente acima com menor recuo.

Relação Pai/Filho:

SELECT STATEMENT é o pai do HASH JOIN.
HASH JOIN é pai das operações TABLE ACCESS FULL das tabelas CLIENTES e PEDIDOS.

Entender essa estrutura hierárquica é crucial para analisar como o Oracle executa a consulta e identificar possíveis otimizações, como a criação de índices ou a reescrita da consulta para melhorar o desempenho.
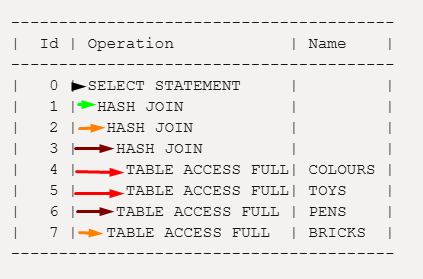
The execution plan step by step
1. First operation (red arrow): initial fetch of the COLOURS and TOYS tables
- Execution starts by fetching data from the COLOURS table (
TABLE ACCESS FULL, line 4). - Next, data from the TOYS table is fetched (
TABLE ACCESS FULL, line 5). - This data is passed to the first HASH JOIN (
linha 3), which combines the results of these tables.
2. Second operation (purple arrow): adding the PENS table
- After joining the
COLOURSandTOYStables, the database accesses the PENS table (TABLE ACCESS FULL, line 6). - The result of the first HASH JOIN is combined with data from the
PENStable through another HASH JOIN (linha 2). - At this point, we have a new dataset containing the data already filtered and processed.
3. Third operation (orange arrow): fetching from the BRICKS table
- The next step is to fetch data from the BRICKS table (
TABLE ACCESS FULL, line 7). - The result of the previous join (the dataset from step 2) is now joined to the
BRICKStable through a HASH JOIN (linha 1).
4. Final operation (green arrow): returning the result
- The final HASH JOIN combines all the results and returns the data to the client through the SELECT STATEMENT (
linha 0). - Since there are no more children in the structure, this step completes the execution.
Execution order summary
The correct execution order can be described like this:
TABLE ACCESS FULL COLOURS(line 4) → first data set.TABLE ACCESS FULL TOYS(line 5) → second data set.HASH JOIN(line 3) → combination ofCOLOURSandTOYS.TABLE ACCESS FULL PENS(line 6) → third data set.HASH JOIN(line 2) → combination of the first HASH JOIN result withPENS.TABLE ACCESS FULL BRICKS(line 7) → fourth data set.HASH JOIN(line 1) → combination of the second join result withBRICKS.SELECT STATEMENT(line 0) → returns the final result to the client.
Understanding the structure and execution order of an execution plan is essential for diagnosing and optimizing query performance in Oracle Database. By analyzing each operation and its interactions in detail, you can identify bottlenecks and apply targeted improvements, resulting in more efficient queries and more responsive systems.
References:
https://blogs.oracle.com/connect/post/how-to-read-an-execution-plan