

The alarm lands in the WhatsApp of the person who fixes it, cause included
Zabbix, Prometheus, Grafana and VictoriaMetrics watching your entire environment, on-premise and cloud, plus FuruTrace reading logs and traces in real time. When something goes off track, nobody has to open a dashboard: the alert goes straight to the team’s phone. And every alarm becomes a line in the monthly report.
An alarm sitting on a dashboard saves no one
Every monitoring tool turns on a red light somewhere. The difference is who sees that light at 3 a.m. Here, the environment talks to the team on the channel the team already uses.
The alert goes after the team, not the other way around
Every rule that fires becomes a message in the right group: the on-call DBA, infrastructure, your internal team or all three, whichever way we agree to set it up. No waiting for someone to log into a console to find out the disk filled up.
The same channel works both ways: the team reports what it is doing, you follow along in real time, and the whole conversation stays recorded in the ticket.
- Routing by criticality: what wakes someone up and what waits for business hours
- PROD and NON-PROD in separate groups, because the urgency is different
- No alarms repeating every 5 minutes: too much noise becomes noise nobody hears
🔴 srv-app02: filesystem /u01 at 92%. Up 7 points in 40 minutes. Where it comes from: database trace files piling up since midnight.03:41
"High CPU" is not a diagnosis, it is a symptom
An alert that only says CPU went up dumps the problem in the lap of whoever receives it. Ours arrives correlated: which host, which database, which wait event and which SQL is behind the contention.
It is the same intelligence that runs in FuruFlow for our managed support clients, applied to the entire environment: infrastructure, application and database on the same timeline.
enq: TX row lock contention waits concentrated on UPDATE estoque SET saldo = :b1 WHERE sku = :b2, blocking session open for 6 minutes.
Blocking session identified and handled with the application team. Latency back to normal at 14:11. Root cause recorded: closing routine triggered outside its window.
Every alarm becomes a number, and numbers become decisions
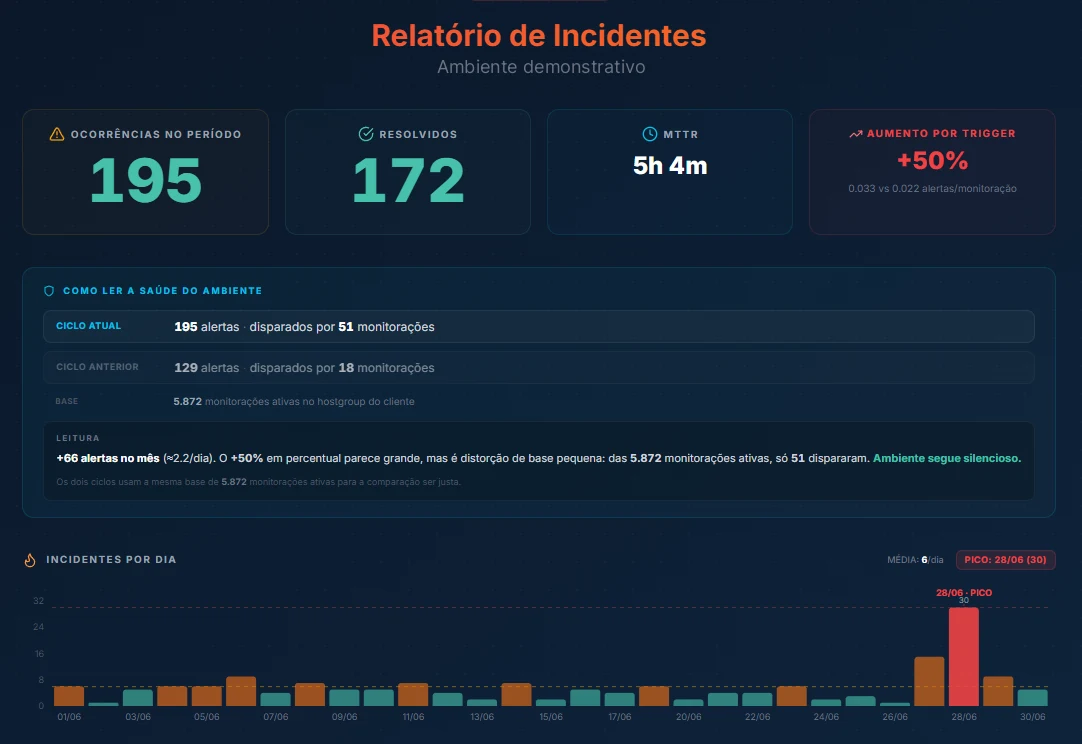
Every message sent gets recorded. At the end of the month that turns into a report showing what alarmed the most, what was resolved before users noticed, and what keeps coming back because the root cause has not been addressed yet.
It is not a decorative PDF: it is next month’s priority list, with the cost of each recurrence right beside it.
- Source ranking: what alarms the most and why
- Recurrence: what came back and how many times
- Time from alarm to resolution, alarm by alarm
What stays under watch
Monitoring only the database means seeing half the story. What takes the application down usually starts one layer below, and collection covers that layer too.
Databases
Oracle, SQL Server, PostgreSQL, MySQL/MariaDB and MongoDB: sessions, waits, locks, growth, jobs and backup, interpreted by specialists who know the subject.
Servers and operating system
Linux and Windows: CPU, memory, disk, filesystem, services that went down and processes running out of pattern, in the datacenter or in the cloud.
Cloud
AWS, OCI and Azure: instances, managed services, account limits and cost. Whatever is climbing on the bill shows up before it becomes a surprise.
Containers and orchestration
Docker and Kubernetes: pods restarting on their own, nodes out of resources, a deploy that degraded response time right after going live.
Logs and traces with FuruTrace
The application tells its side too. Logs and traces analyzed in real time connect the error the user saw to what happened in the infrastructure at that same second.
Backup and scheduled jobs
A backup that did not run is the most silent and most expensive alarm there is. Job, window and result checked every day, not just on restore day.
Industry-standard tools, run by people who get it
No proprietary black box locking you in. The foundation is open and well established; what Furushima adds is the right rule, the right threshold and someone awake to act when it fires.
What people ask about monitoring
I already run Zabbix here. Do I need to switch tools?
No. We build on what is already in place. If your Zabbix is up, we review templates, clean out false alarms, fix thresholds and wire the output into WhatsApp. If nothing exists yet, we deploy the full stack from scratch.
Won’t WhatsApp alarms turn into group spam?
They will, if the thresholds are wrong. That is why fine-tuning is part of the service: grouping of repeated events, scheduled silence during maintenance windows and separation by criticality. What wakes someone up at night is different from what waits for business hours.
Do you only monitor, or do you fix things too?
Both, and you choose how far it goes. Some clients want only the alert so their internal team can act; others hire 24×7 managed support and a Furushima specialist fixes it directly, with approval over WhatsApp whenever an action needs your sign-off.
Are monitoring and FuruFlow the same thing?
They are different layers of the same service. Monitoring covers the entire environment: servers, cloud, containers, application and database. FuruFlow is our own platform that goes deeper on the database side, with validated forecasting, daily AI diagnostics and an executive report.
Does it work on-premise, in the cloud or in hybrid environments?
All three. Collection runs in your own datacenter, on AWS, OCI and Azure, and in environments that live half in each place, which is the most common case in practice.
Want to find the problem before your customer does?
Tell us how your environment is monitored today and a specialist will show you what is slipping through. No commitment and no 40-slide deck.