

Continuing with part 2 of our article on execution plans, we will look at how to analyze and interpret an execution plan in the PostgreSQL database.
Following my usual approach to this kind of analysis, we can work with 2 modes:
- Execution plan in text/tabular mode, where the steps are shown in indented form.
- Execution plan in tree mode, where the steps are shown graphically.
Similar to Oracle Database, PostgreSQL uses the following methodology for interpreting execution plans: the execution plan is read from the bottom up and from right to left, reflecting the sequence in which PostgreSQL executes the operations.
In PostgreSQL, execution plans are read from the bottom up and from right to left. This means that:
- The deepest (most nested) operation in the plan is the first one to be executed.
- Outer or upper operations run later, processing the data produced by the operations below them.
This approach makes it easier to understand the flow of query execution and identify potential performance bottlenecks.
To make the explanation more concrete, we will analyze a sample query, interpret its execution plan, and then look at possible optimizations to make the SQL run more efficiently.
 SELECT * FROM (
    (SELECT
        poi.supplier_product ->> 'supplier_product_name' AS name,
        poi.price AS price,
        poi.created_at AS expires_at,
        poi.supplier_product ->> 'supplier_product_manufacturer' AS manufacturer,
        poi.supplier_product ->> 'supplier_product_packing' AS packing,
        poi.supplier_product ->> 'supplier_product_pack_quantity' AS pack_quantity,
        poi.supplier_product ->> 'supplier_product_unit_purchase' AS unit_purchase,
        poi.confirmed_quantity AS quantity_price,
        sp.name AS name_supply,
        sp.identifier AS identifier_supply,
        1 AS order_by
    FROM purchase_order_items poi
    INNER JOIN purchase_orders po ON po.id = poi.purchase_order_id
    INNER JOIN buyer_products bp ON bp.buyer_id = po.buyer_id AND
        bp.code = poi.buyer_product ->> 'buyer_product_code'
    INNER JOIN products p ON p.id = bp.base_product_id
    INNER JOIN suppliers sp ON sp.id = po.supplier_id
    WHERE bp.id = 12081956
        AND poi.created_at < '2025-02-21 16:57:59.225571'
    ORDER BY poi.created_at DESC
    LIMIT 3
    )
    UNION ALL
    (SELECT
        bp.name,
        bp.source_price AS price,
        bp.created_at AS expires_at,
        '' AS manufacturer,
        '' AS packing,
        '' AS pack_quantity,
        '' AS unit_purchase,
        0 AS quantity_price,
        '' AS name_supply,
        '' AS identifier_supply,
        2 AS order_by
    FROM public.buyer_products bp
    INNER JOIN public.products p ON p.id = bp.base_product_id
    WHERE bp.id = 12081956
        AND bp.source_price IS NOT NULL
    )
) b
ORDER BY order_by
LIMIT 3;
To analyze the execution plans, we will use two tools that help visualize and interpret the data. Each tool presents the plan in a different way, allowing for a more complete analysis:
- Tabular mode: Explain Depesz: Displays the execution plan in tabular format, making it easier to read the steps in a structured way.
https://explain.depesz.com/ - Tree mode: Explain Dalibo: Represents the execution plan graphically, making the hierarchy of operations more intuitive.
https://explain.dalibo.com/
📌 Instructions: Click the links above to access the tools and follow the visualization procedure for both methods.
To view the execution plan in both modes, we first need to extract it in text format. To do that, simply add the following statement at the beginning of the query:
EXPLAIN (ANALYZE, COSTS, VERBOSE, BUFFERS)
(...) SQL CODE (...)
This statement provides detailed information about query execution, including:
- ANALYZE: Actually runs the query and returns real statistics for execution time and the number of rows processed.
- COSTS: Displays the estimated costs of each operation in the execution plan.
- VERBOSE: Shows additional details, such as the query structure and the list of columns involved.
- BUFFERS: Shows information about memory cache (buffer) usage during execution.
Below, see what the complete SQL code will look like with EXPLAIN added to the query.
 EXPLAIN (ANALYZE, COSTS, VERBOSE, BUFFERS )
 SELECT * FROM (
    (SELECT
        poi.supplier_product ->> 'supplier_product_name' AS name,
        poi.price AS price,
        poi.created_at AS expires_at,
        poi.supplier_product ->> 'supplier_product_manufacturer' AS manufacturer,
        poi.supplier_product ->> 'supplier_product_packing' AS packing,
        poi.supplier_product ->> 'supplier_product_pack_quantity' AS pack_quantity,
        poi.supplier_product ->> 'supplier_product_unit_purchase' AS unit_purchase,
        poi.confirmed_quantity AS quantity_price,
        sp.name AS name_supply,
        sp.identifier AS identifier_supply,
        1 AS order_by
    FROM purchase_order_items poi
    INNER JOIN purchase_orders po ON po.id = poi.purchase_order_id
    INNER JOIN buyer_products bp ON bp.buyer_id = po.buyer_id AND
        bp.code = poi.buyer_product ->> 'buyer_product_code'
    INNER JOIN products p ON p.id = bp.base_product_id
    INNER JOIN suppliers sp ON sp.id = po.supplier_id
    WHERE bp.id = 12081956
        AND poi.created_at < '2025-02-21 16:57:59.225571'
    ORDER BY poi.created_at DESC
    LIMIT 3
    )
    UNION ALL
    (SELECT
        bp.name,
        bp.source_price AS price,
        bp.created_at AS expires_at,
        '' AS manufacturer,
        '' AS packing,
        '' AS pack_quantity,
        '' AS unit_purchase,
        0 AS quantity_price,
        '' AS name_supply,
        '' AS identifier_supply,
        2 AS order_by
    FROM public.buyer_products bp
    INNER JOIN public.products p ON p.id = bp.base_product_id
    WHERE bp.id = 12081956
        AND bp.source_price IS NOT NULL
    )
) b
ORDER BY order_by
LIMIT 3;
After running the EXPLAIN command, PostgreSQL generates an execution plan in text format. Below is an example of the plan generated for this query:
 Limit  (cost=120200.56..120200.57 rows=2 width=252) (actual time=207.212..207.217 rows=3 loops=1)
   Output: ((poi.supplier_product ->> 'supplier_product_name'::text)), poi.price, poi.created_at, ((poi.supplier_product ->> 'supplier_product_manufacturer'::text)), ((poi.supplier_product ->> 'supplier_product_packing'::text)), ((poi.supplier_product ->> 'supplier_product_pack_quantity'::text)), ((poi.supplier_product ->> 'supplier_product_unit_purchase'::text)), poi.confirmed_quantity, sp.name, sp.identifier, (1)
   Buffers: shared hit=64032
   ->  Sort  (cost=120200.56..120200.57 rows=2 width=252) (actual time=186.714..186.718 rows=3 loops=1)
         Output: ((poi.supplier_product ->> 'supplier_product_name'::text)), poi.price, poi.created_at, ((poi.supplier_product ->> 'supplier_product_manufacturer'::text)), ((poi.supplier_product ->> 'supplier_product_packing'::text)), ((poi.supplier_product ->> 'supplier_product_pack_quantity'::text)), ((poi.supplier_product ->> 'supplier_product_unit_purchase'::text)), poi.confirmed_quantity, sp.name, sp.identifier, (1)
         Sort Key: (1)
         Sort Method: quicksort  Memory: 25kB
         Buffers: shared hit=64032
         ->  Append  (cost=120195.05..120200.49 rows=2 width=252) (actual time=186.639..186.704 rows=4 loops=1)
               Buffers: shared hit=64032
               ->  Limit  (cost=120195.05..120195.06 rows=1 width=242) (actual time=186.637..186.640 rows=3 loops=1)
                     Output: ((poi.supplier_product ->> 'supplier_product_name'::text)), poi.price, poi.created_at, ((poi.supplier_product ->> 'supplier_product_manufacturer'::text)), ((poi.supplier_product ->> 'supplier_product_packing'::text)), ((poi.supplier_product ->> 'supplier_product_pack_quantity'::text)), ((poi.supplier_product ->> 'supplier_product_unit_purchase'::text)), poi.confirmed_quantity, sp.name, sp.identifier, 1
                     Buffers: shared hit=64024
                     ->  Sort  (cost=120195.05..120195.06 rows=1 width=242) (actual time=186.619..186.621 rows=3 loops=1)
                           Output: ((poi.supplier_product ->> 'supplier_product_name'::text)), poi.price, poi.created_at, ((poi.supplier_product ->> 'supplier_product_manufacturer'::text)), ((poi.supplier_product ->> 'supplier_product_packing'::text)), ((poi.supplier_product ->> 'supplier_product_pack_quantity'::text)), ((poi.supplier_product ->> 'supplier_product_unit_purchase'::text)), poi.confirmed_quantity, sp.name, sp.identifier, 1
                           Sort Key: poi.created_at DESC
                           Sort Method: top-N heapsort  Memory: 26kB
                           Buffers: shared hit=64024
                           ->  Nested Loop  (cost=2.04..120195.04 rows=1 width=242) (actual time=0.193..186.435 rows=273 loops=1)
                                 Output: (poi.supplier_product ->> 'supplier_product_name'::text), poi.price, poi.created_at, (poi.supplier_product ->> 'supplier_product_manufacturer'::text), (poi.supplier_product ->> 'supplier_product_packing'::text), (poi.supplier_product ->> 'supplier_product_pack_quantity'::text), (poi.supplier_product ->> 'supplier_product_unit_purchase'::text), poi.confirmed_quantity, sp.name, sp.identifier, 1
                                 Inner Unique: true
                                 Buffers: shared hit=64024
                                 ->  Nested Loop  (cost=1.75..120194.70 rows=1 width=423) (actual time=0.169..181.896 rows=273 loops=1)
                                       Output: poi.supplier_product, poi.price, poi.created_at, poi.confirmed_quantity, po.supplier_id
                                       Inner Unique: true
                                       Buffers: shared hit=63194
                                       ->  Nested Loop  (cost=1.31..120192.03 rows=1 width=427) (actual time=0.154..181.249 rows=273 loops=1)
                                             Output: poi.supplier_product, poi.price, poi.created_at, poi.confirmed_quantity, po.supplier_id, bp.base_product_id
                                             Join Filter: ((bp.code)::text = (poi.buyer_product ->> 'buyer_product_code'::text))
                                             Rows Removed by Join Filter: 48357
                                             Buffers: shared hit=62374
                                             ->  Nested Loop  (cost=0.87..7304.32 rows=6352 width=19) (actual time=0.037..8.088 rows=9209 loops=1)
                                                   Output: po.id, po.supplier_id, bp.code, bp.base_product_id
                                                   Buffers: shared hit=4649
                                                   ->  Index Scan using buyer_products_pkey on public.buyer_products bp  (cost=0.44..2.68 rows=1 width=15) (actual time=0.016..0.018 rows=1 loops=1)
                                                         Output: bp.id, bp.base_product_id, bp.buyer_id, bp.created_at, bp.updated_at, bp.external_id, bp.name, bp.code, bp.status, bp.source_price, bp.identifier, bp.accept_alternative_brands, bp.id_scub, bp.internal_scub_id, bp.detailed_description, bp.buyer_product_children
                                                         Index Cond: (bp.id = 12081956)
                                                         Buffers: shared hit=4
                                                   ->  Index Scan using index_purchase_orders_on_buyer_id on public.purchase_orders po  (cost=0.43..7100.53 rows=6704 width=12) (actual time=0.012..6.880 rows=9209 loops=1)
                                                         Output: po.id, po.supplier_id, po.total_price, po.items_count, po.created_at, po.updated_at, po.confirmation_id, po.synchronized_at, po.buyer_id, po.observation, po.sequence, po.origin_id, po.origin_type, po.external_id, po.redirect_to_legacy, po.name, po.origin_observation, po.opened_at, po.contact, po.terms_and_conditions, po.freight_type, po.minimum_purchase, po.valid_until, po.payment_method_id, po.billing_address, po.uuid, po.created_by, po.created_by_info, po.pending_download, po.text_search_vector, po.request_id, po.upload_id, po.upload_id_gr
                                                         Index Cond: (po.buyer_id = bp.buyer_id)
                                                         Buffers: shared hit=4645
                                             ->  Index Scan using index_purchase_order_items_on_purchase_order_id on public.purchase_order_items poi  (cost=0.44..9.90 rows=225 width=751) (actual time=0.002..0.006 rows=5 loops=9209)
                                                   Output: poi.id, poi.purchase_order_id, poi.created_at, poi.updated_at, poi.status, poi.confirmed_quantity, poi.cancellation, poi.supplier_observation, poi.opening_quantity, poi.supplier_product, poi.buyer_product, poi.sequence_number, poi.price, poi.comments, poi.origin, poi.uuid, poi.sequence_seller_item_number
                                                   Index Cond: (poi.purchase_order_id = po.id)
                                                   Filter: (poi.created_at < '2025-02-21 16:57:59.225571'::timestamp without time zone)
                                                   Rows Removed by Filter: 0
                                                   Buffers: shared hit=57725
                                       ->  Index Only Scan using products_pkey on public.products p  (cost=0.44..2.68 rows=1 width=4) (actual time=0.002..0.002 rows=1 loops=273)
                                             Output: p.id
                                             Index Cond: (p.id = bp.base_product_id)
                                             Heap Fetches: 0
                                             Buffers: shared hit=820
                                 ->  Index Scan using idx_sp_on_id on public.suppliers sp  (cost=0.29..0.33 rows=1 width=58) (actual time=0.002..0.002 rows=1 loops=273)
                                       Output: sp.id, sp.name, sp.created_at, sp.updated_at, sp.external_id, sp.identifier, sp.identifier_kind, sp.bio_id, sp.synchronized_at, sp.bioid_synchronized_at, sp.phone, sp.plan_name, sp.metadata, sp.is_external
                                       Index Cond: (sp.id = po.supplier_id)
                                       Buffers: shared hit=828
               ->  Subquery Scan on "*SELECT* 2"  (cost=0.87..5.38 rows=1 width=252) (actual time=0.058..0.060 rows=1 loops=1)
                     Output: "*SELECT* 2".name, "*SELECT* 2".price, "*SELECT* 2".expires_at, ''::text, ''::text, ''::text, ''::text, 0, ''::character varying, ''::character varying, 2
                     Buffers: shared hit=8
                     ->  Nested Loop  (cost=0.87..5.34 rows=1 width=262) (actual time=0.054..0.055 rows=1 loops=1)
                           Output: bp_1.name, bp_1.source_price, bp_1.created_at, ''::text, ''::text, ''::text, ''::text, 0, ''::character varying, ''::character varying, 2
                           Inner Unique: true
                           Buffers: shared hit=8
                           ->  Index Scan using idx_bp_on_id_source_price on public.buyer_products bp_1  (cost=0.43..2.67 rows=1 width=66) (actual time=0.013..0.013 rows=1 loops=1)
                                 Output: bp_1.id, bp_1.base_product_id, bp_1.buyer_id, bp_1.created_at, bp_1.updated_at, bp_1.external_id, bp_1.name, bp_1.code, bp_1.status, bp_1.source_price, bp_1.identifier, bp_1.accept_alternative_brands, bp_1.id_scub, bp_1.internal_scub_id, bp_1.detailed_description, bp_1.buyer_product_children
                                 Index Cond: (bp_1.id = 12081956)
                                 Buffers: shared hit=4
                           ->  Index Only Scan using products_pkey on public.products p_1  (cost=0.44..2.68 rows=1 width=4) (actual time=0.005..0.005 rows=1 loops=1)
                                 Output: p_1.id
                                 Index Cond: (p_1.id = bp_1.base_product_id)
                                 Heap Fetches: 0
                                 Buffers: shared hit=4
 Query Identifier: 273579094919034765
 Planning:
   Buffers: shared hit=129
 Planning Time: 3.160 ms
 JIT:
   Functions: 34
   Options: Inlining false, Optimization false, Expressions true, Deforming true
   Timing: Generation 1.963 ms, Inlining 0.000 ms, Optimization 0.883 ms, Emission 19.683 ms, Total 22.528 ms
 Execution Time: 209.321 ms
(82 rows)
Just like Oracle Database, PostgreSQL uses indentation, represented by the -> symbol, to indicate the order in which operations are executed, without assigning a sequential identifier to each step. The greater the indentation before the ->, the more internal (or deeper) the step is in the execution plan. This means the most indented steps are executed first.
With the execution plan in text format, we can use the two tools presented above to run the analysis and identify potential bottlenecks in query execution. Next, we will explore both approaches and show how to spot the main optimization opportunities in the SQL.
We will take the text-format execution plan generated earlier and submit it to the Explain Depesz tool, which presents the analysis in tabular format. You can access it through the following link: Explain Depesz.
https://explain.depesz.com/
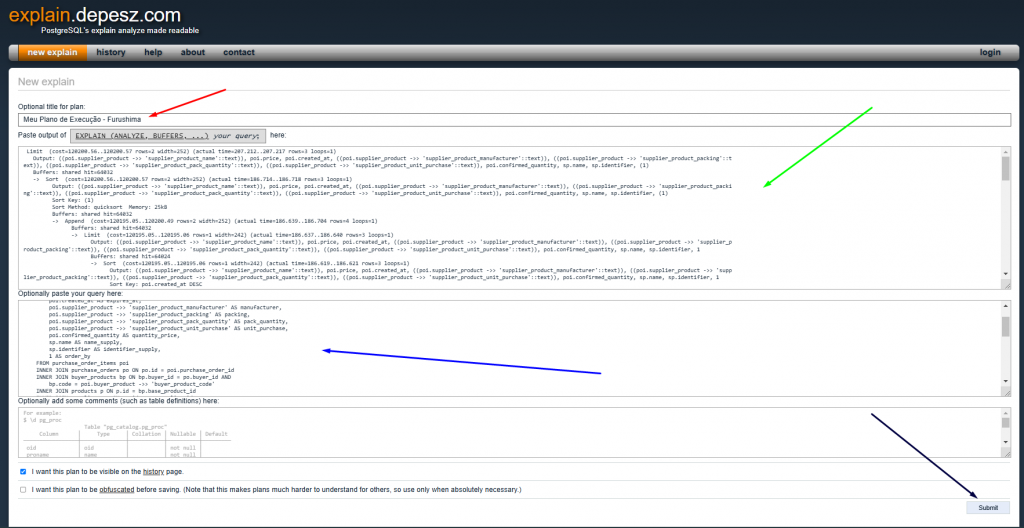
Steps to view the execution plan in Explain Depesz:
- 🔴 Red arrow: Enter a title for the execution plan (optional, but it helps keep things organized).
- 🟢 Green arrow: Paste the execution plan generated in text format.
- 🔵 Blue arrow: Paste the query used to generate the execution plan.
- ⚫ Black arrow: After filling in the fields above, click Submit to process and view the execution plan.
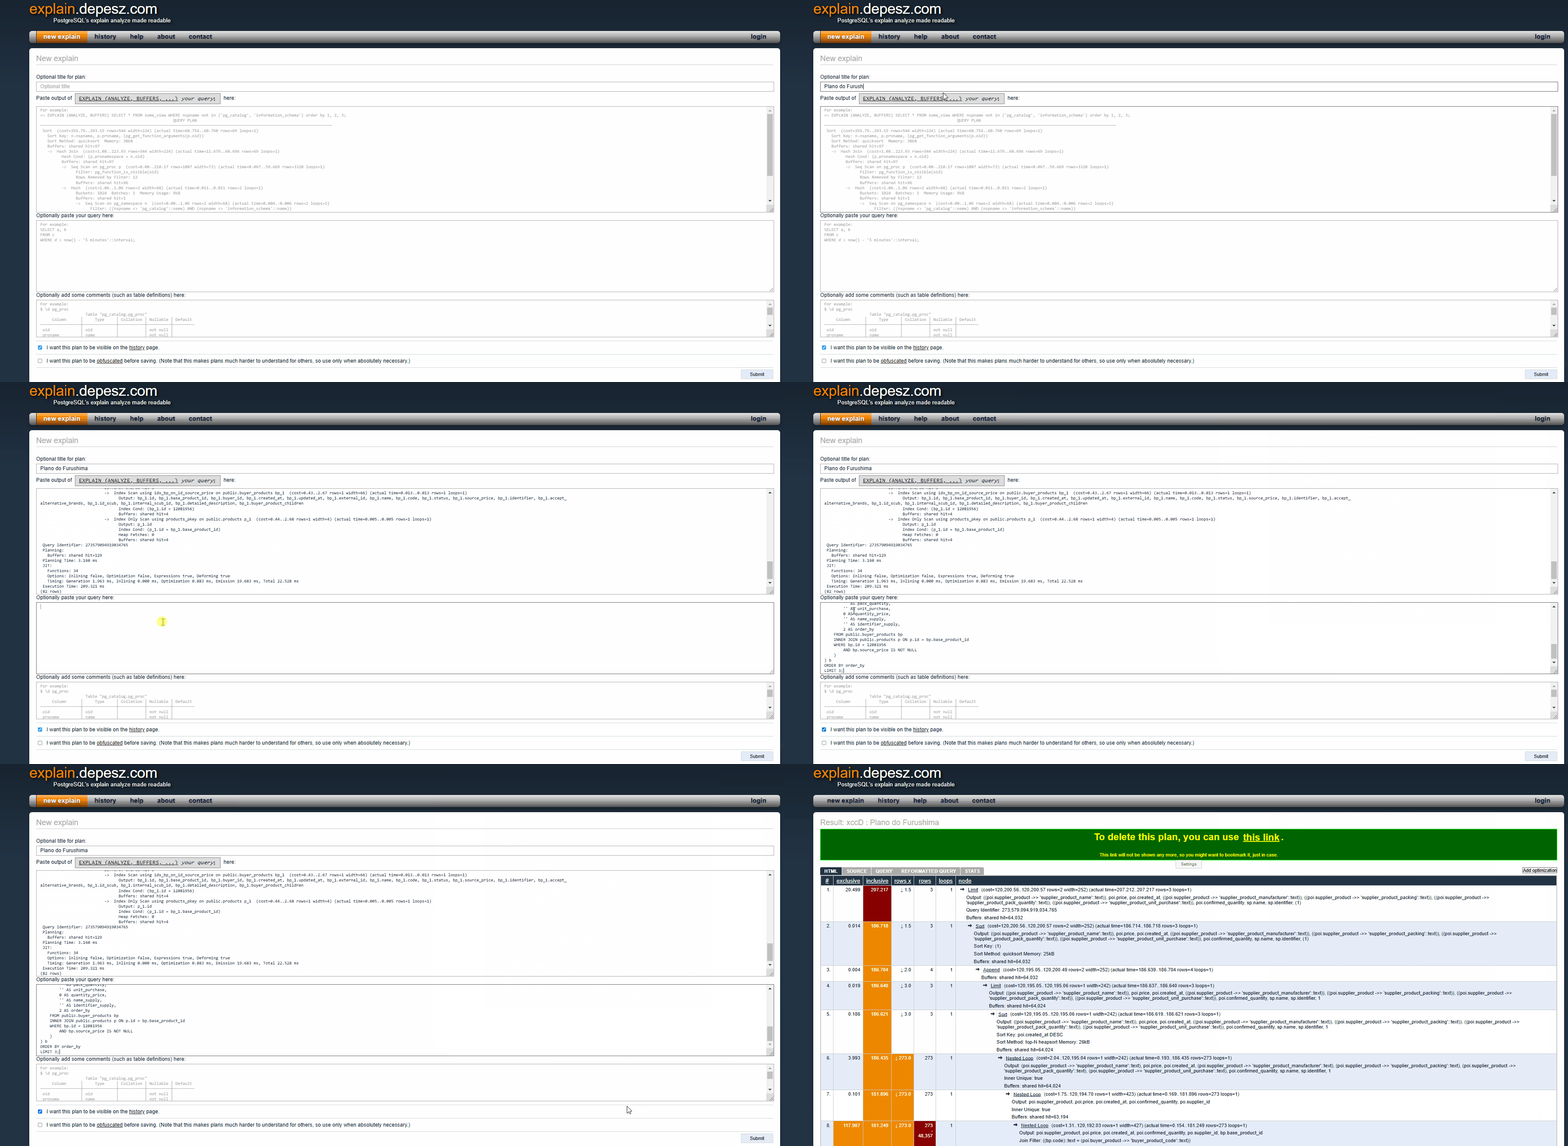
After submitting the execution plan, note the main bottlenecks identified in the demonstration below. They are highlighted in orange and red, indicating the most expensive operations. In addition, the highlighted excerpts represent query clauses that can be optimized to improve performance.
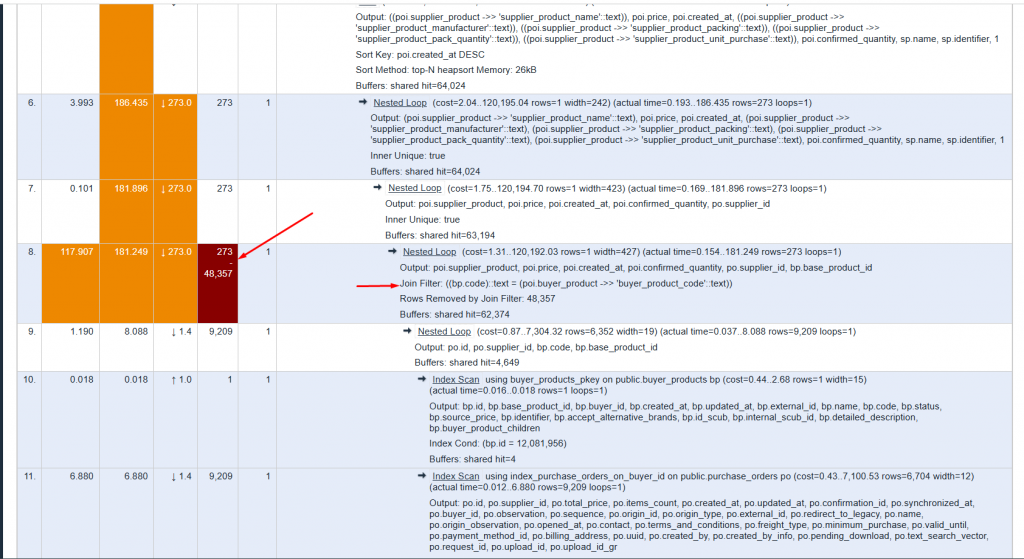
Nested Loop (cost=1.31..120,192.03 rows=1 width=427) (actual time=0.154..181.249 rows=273 loops=1)
Output: poi.supplier_product, poi.price, poi.created_at, poi.confirmed_quantity, po.supplier_id, bp.base_product_id
Join Filter: ((bp.code)::text = (poi.buyer_product ->> ‘buyer_product_code’::text))
Rows Removed by Join Filter: 48,357
Buffers: shared hit=62,374
📌 What does this mean?
- PostgreSQL is running a Nested Loop Join to combine data from the buyer_products (bp) and purchase_order_items (poi) tables.
- Estimated cost: 120,192 → This indicates it is one of the heaviest steps in the plan.
- Actual time spent: 181.249 ms → This confirms the operation really is taking a long time.
🚨 Problem identified:
- The Nested Loop Join can be inefficient, especially when many rows need to be compared.
🔹 Join details and the filter problem
Join Filter: ((bp.code)::text = (poi.buyer_product ->> ‘buyer_product_code’::text))
Rows Removed by Join Filter: 48,357
📌 What does this mean?
- PostgreSQL is trying to join
bp.codewith the JSON fieldpoi.buyer_product ->> 'buyer_product_code'. - However, 48,357 rows were read and then discarded because they did not match the filter.
This means a lot of unnecessary data was loaded before filtering.
🚨 Problem identified:
- The JSON comparison filter is extremely inefficient.
- PostgreSQL has to scan every row before knowing which ones actually belong in the join.
Buffers: shared hit=62,374

📌 O que isso significa?- 62,374 memory blocks were accessed in the PostgreSQL cache.
- This indicates that no disk reads were needed, which is a good sign.
- However, even with no disk reads, the query is still slow, which shows the problem lies in the query logic, not just the hardware.
🔹 How do we optimize this part of the plan?
Now that we know the Nested Loop Join and the JSON filter are the main problems, we can suggest improvements:
1️⃣ Create an index to improve the JSON comparison
The (bp.code)::text = (poi.buyer_product ->> 'buyer_product_code'::text) comparison is very expensive, since PostgreSQL has to process the JSON data before comparing it.
🚀 Solution: Create a functional index on the JSON
CREATE INDEX idx_poi_buyer_product_code ON purchase_order_items ((buyer_product ->> 'buyer_product_code'));

CREATE INDEX idx_poi_purchase_order_id_created_at ON purchase_order_items (purchase_order_id, created_at DESC);
📌 Expected impact:
- PostgreSQL will be able to use the index directly to find matches.
- It drastically reduces the number of rows removed by the
Join Filter. - It reduces the need to scan every row in the table.
- It shortens lookup time in the
purchase_order_items. - It improves the performance of the
Nested Loop.
📌 Problems identified:
- The Join Filter is discarding too many rows (48,357 removed).
- The Nested Loop Join is not efficient for large data volumes.
- There is no efficient index for JSON lookups.
- There is no composite index on
purchase_order_itemsfor fast joins.
🚀 Suggested improvements:
✅ Create an index to optimize the JSON lookup.
✅ Use a Hash Join instead of Nested Loop.
✅ Create a composite index to improve the joins.
Improving the analysis and using the EXPLAIN DALIBO tool
Now that we have identified the bottlenecks and proposed solutions, let’s approach the problem from a new perspective using the EXPLAIN Dalibo tool.
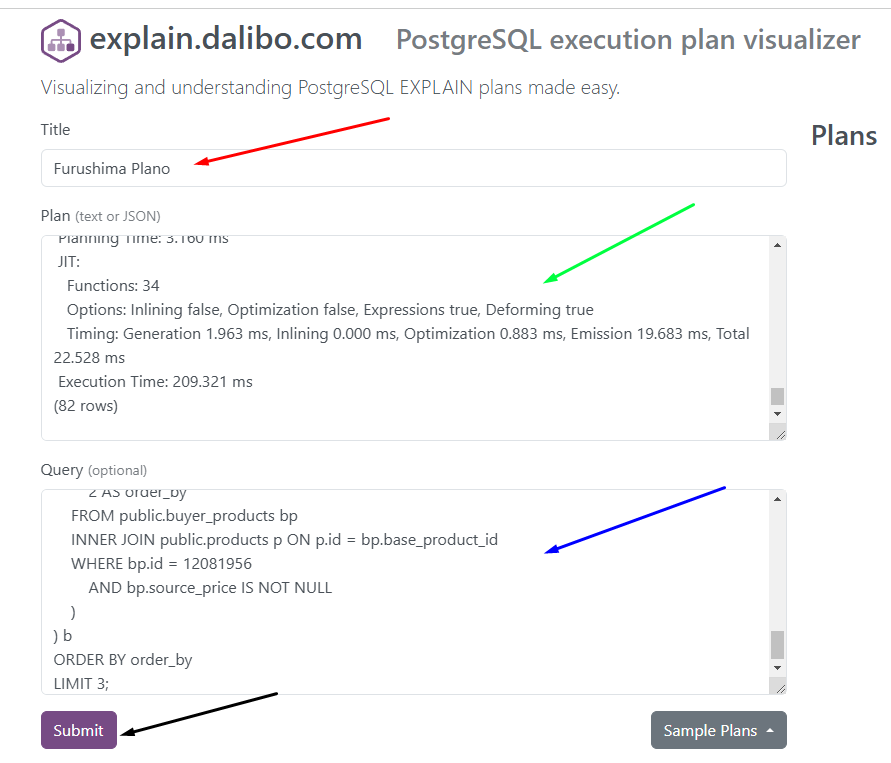
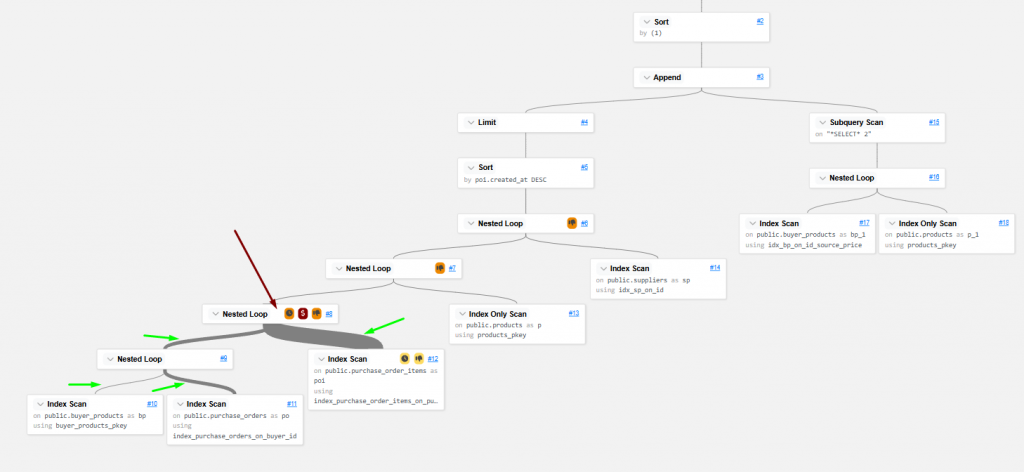

Note that the Nested Loop box represents the query’s main bottleneck, and the “Join Filter” is tied to the ((bp.code)::text = (poi.buyer_product ->> 'buyer_product_code'::text)) condition, which indicates an inefficient join that directly impacts query performance.
Conclusion
In this article, we explored two approaches to analyzing and optimizing a SQL query in PostgreSQL:
- EXPLAIN ANALYZE → Provides a detailed report on query execution, helping identify costs, execution time, and key statistics.
- EXPLAIN Dalibo → Presents a visual, intuitive format, making it easier to spot the query’s critical points, such as Nested Loops, inefficient filters, and unnecessary sorts.
We also learned how to identify bottlenecks in query execution, such as the inefficient Join Filter and manual sorting without index support. From there, we applied strategic indexes and suggested switching join algorithms to improve performance.
The main takeaway here is that before optimizing a query, it is essential to understand how PostgreSQL executes it, locate the bottlenecks, and apply surgical adjustments, such as creating indexes and choosing the most efficient join type. 🚀